


Crypto-currencies are volatile, but the market is changing. The volatility of bitcoin has been steadily decreasing throughout 2018 trading, and I expect this trend to continue. This post will evaluate some easy ways to track volatility.
When evaluating volatility, we should distinguish historical volatility from implied volatility. Generally, financial volatility refers to the variation of a trading price series as measured by the standard deviation. But looking backwards using historical data only tells us what we already know, this is called Historical Volatility. But in order to get a current estimate of future volatility, we need to examine implied volatility. Measuring Implied Volatility is done by using an option pricing model such as Black-Scholes, where we can input available data to isolate the volatility implied in an option’s price.
You can build your own option calculator using excel, or you can use pre-built calculators such as the CBOE option price calculator. Either way, once you have the option’s price, strike price, and expiration date, you can solve for implied volatility.
Instead of making these calculations yourself, you can also use site like BitVol, which keeps a running tally of bitcoin price volatility.
For an even better estimate of volatility, I suggest using Deribit, which is a bitcoin derivatives exchange with some cool features. By navigating to Deribit’s options market, users can view option price chains that include the current implied volatility associated with each option price.
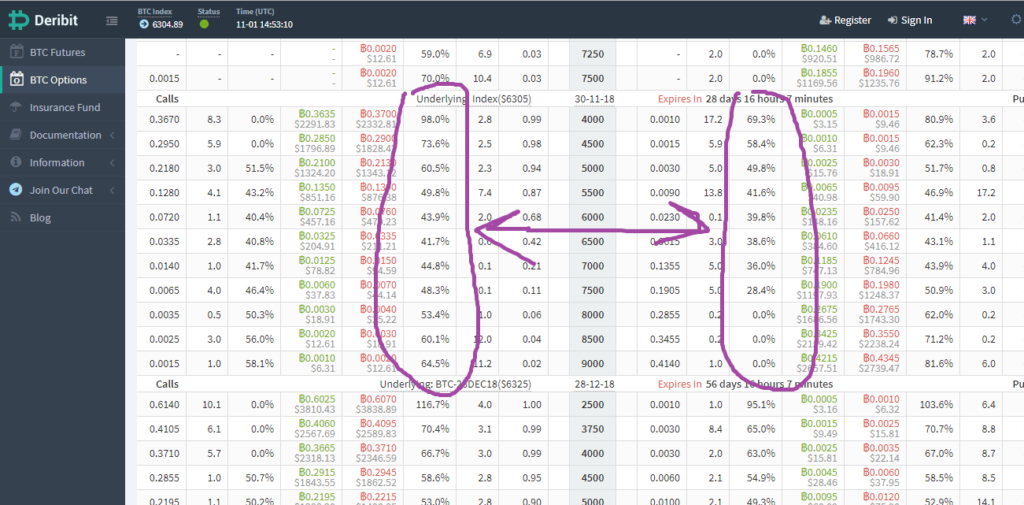
The image above crudely shows where to find the implied volatility level associated with each specific option price. You can also view implied volatility for both current bid prices and ask prices of both puts and calls.
This information is super useful for option traders since, depending on your strategy, you’ll benefit from buying options when volatility is low and selling options when volatility is high. Option traders can also isolate volatility by using option spreads that neutralize price movements of the underlying.
What are the current trends in bitcoin volatility? At the time of writing (November 2018), volatility is falling. Deribit users can also navigate to the Historical Volatility tab from the options market page. The graph displayed from this page shows historical volatility over the past 30 days. From a high of 41.87% at the beginning of October 2018, 30 day historical realized volatility has now fallen to a low of 14.45%. At the time of writing, bitcoin implied volatility is still hovering around 40% on average for strikes expiring in 30 days. This means traders are still willing to pay for the expectation that bitcoin will remain relatively volatile.